FINANCIAL PERFORMANCE REPRESENTATIONS
Indulge in the luxurious potential earnings of a Hammer & Nails® Unit franchise or “Shop.” Our grooming sanctuaries provide a premium experience for the modern man, and our financial performance is just as impressive.
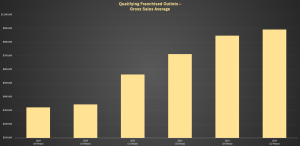
The chart below showcases the gross revenue figures for Qualifying Franchised Outlets. These shops have been open for business for at least 12 months as of December 31, 2024. Please note that any shops that opened in 2024 are not included in the charts below.
AVERAGE GROSS SALES OF FRANCHISED OUTLETS
| Qualifying Franchised Outlets – Gross Sales | ||||||
| High | Top 25% | Average | Median | Low | # of Shops | |
| 2019 | $453,052 | $425,345 | $322,057 | 332,600 | $193,380 | 10 |
| 2020 | $646,340 | $383,449 | $344,592 | $338,642 | $111,820 | 10 |
| 2021 | $974,685 | $863,377 | $563,068 | $421,450 | $185,390 | 11 |
| 2022 | $1,453,663 | $1,139,605 | $712,962 | $696,563 | $308,491 | 15 |
| 2023 | $1,669,013 | $1,313,402 | $847,065 | $807,829 | $314,188 | 20 |
| 2024 | $1,845,735 | $1,424,725 | $892,965 | $821,875 | $339,581 | 32 |
Notes:
Other than the preceding financial performance representation, we do not make any financial performance representations. We also do not authorize our employees or representatives to make any such representations either orally or in writing. If you are purchasing an existing outlet, however, we may provide you with the actual records of that outlet. If you receive any other financial performance information or projections of your future income, you should report it to the franchisor’s management by contacting Aaron Meyers, President and Chief Executive Officer, 101 Parkshore Drive, Suite 100, Folsom, CA 95630, (916) 932-2150, the Federal Trade Commission, and the appropriate state regulatory agencies.
We’re Building
Something Legendary
Our franchise development team is on a roll, and can’t wait to talk to you. Tell us a little
about yourself and we’ll be in touch shortly
Let’s Get Started!

Are you sure you want to close the form? Your progress to this point has been sent, but progress on the current step may be lost.